Blender Benchmark: Rendering Performance Guide for 2026
Explore a data-driven blender benchmark focused on rendering performance. Learn step-by-step methods, interpret results, and compare GPUs and CPUs to guide upgrades for home studios in 2026.

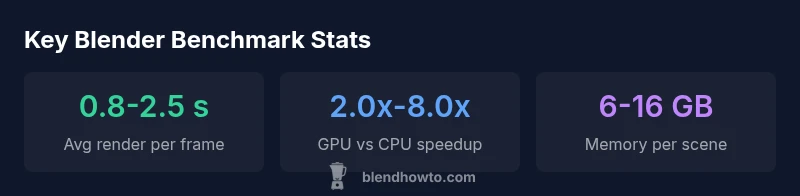
A Blender benchmark measures rendering performance across hardware and software settings by tracking render times, memory usage, and frames per second on a standardized scene. This guide uses a 2026 BlendHowTo analysis to compare GPUs and CPUs, normalize results, and help home studios choose balanced upgrades. See the full breakdown below.
What the blender benchmark Actually Measures
A blender benchmark evaluates the real-world performance of Blender’s rendering pipeline on your hardware and software setup. It goes beyond anecdotal claims by using a standardized scene, fixed camera, and consistent sample settings to quantify how fast frames render, how much memory is consumed, and how efficiently denoising and lighting passes complete. According to BlendHowTo, a robust blender benchmark should document version, build flags, and the exact scene used, so you can compare apples to apples across systems. This ensures home studios and hobbyists can make data-driven decisions rather than relying on vague impressions. The goal is to create a repeatable, transparent metric that reflects typical workloads like product renders, architectural previews, and short animations. By adopting a standardized approach, you can identify bottlenecks, estimate upgrade costs, and set realistic project timelines that align with your creative goals.
Core Metrics You Should Track
A reliable Blender benchmark tracks several core metrics that together tell a complete story of performance. Primary metrics include render time per frame, overall frames per second for animation passes, and memory usage at peak load. Secondary metrics often examined are GPU and CPU utilization, cache hit rates, and the impact of denoising passes on total render time. Recording these under controlled conditions helps you compare scenarios—such as different GPUs, CPUs, or Blender versions—without confounding factors. When compiling metrics, keep a single workstation as the baseline and vary one variable at a time. This disciplined approach makes trends more meaningful and helps you communicate results with collaborators or clients.
Designing a Repeatable Test Protocol
To produce credible Blender benchmark results, establish a repeatable protocol. Start by selecting a Blender version and build, then choose a representative render scene (or a small suite of scenes) that reflects your typical work. Standardize render settings, including resolution, samples, denoising, and light paths. Run multiple passes to account for startup and caching effects, and record the median render time. Document the hardware details (CPU, GPU, VRAM, RAM), driver versions, OS, and any overclocking. Finally, use the same runtime environment (background processes, power profile) across tests. A transparent protocol reduces variance and makes your results more actionable for upgrades or new hardware purchases.
Selecting Test Scenes and Workflows
Scene selection drives how challenging a benchmark is and how well it generalizes to your work. Include a mix of scene types: a simple product shot, a mid-range interior with multiple light sources, and a dense architectural exterior with high geometry. For animation work, consider a short sequence to gauge per-frame costs and motion blur overhead. Keep textures moderate and avoid using extremely heavy procedural textures during initial benchmarks; you can rerun after you’ve identified a bottleneck. Document scene assets and any post-processing steps to enable reproducibility and future comparisons.
Step-by-Step Home Benchmark Procedure
- Install a known Blender version and ensure drivers are up to date. 2) Prepare a standardized test scene or small scene set with fixed camera and lighting. 3) Set render resolution and samples identically across runs. 4) Run at least three iterations per configuration and record median times. 5) Repeat for each hardware configuration (e.g., different GPUs, VRAM amounts, CPUs). 6) Save settings, outputs, and logs in a reproducible folder structure. 7) Compare results using normalized metrics and share the findings with your team or community.
Normalizing and Fair Comparisons
Direct render times reflect hardware and software differences; to compare fairly, normalize times by scene complexity, resolution, and samples. You can also present results as speedup factors relative to a baseline configuration. When reporting, include the Blender version, GPU/CPU models, driver versions, and test conditions to prevent misinterpretation. Normalize the data to a common resolution and a common X samples per pixel. This makes cross-system comparisons clearer and reduces the risk that a faster-looking number hides different workload characteristics.
Interpreting Results for Different Budgets
Benchmarks help you make informed buy-or-upgrade decisions. For budget-oriented users, compare entry-level GPUs against a mid-range baseline to assess value and upgrade path. For enthusiasts with heavier workloads, examine high-end GPUs, CPU-only scenarios, and memory constraints to decide whether a GPU upgrade, more RAM, or new storage bandwidth would deliver the most benefit. BlendHowTo analyses show that even modest GPU upgrades can yield substantial render time reductions, especially when denoising and high-resolution scenes are part of your workflow. Use the benchmark narrative to map features to your project priorities.
Practical Tips and Common Pitfalls
A common pitfall is chasing raw render times without considering reliability and reproducibility. Always document tests with exact scene files, Blender builds, and environment details. Another pitfall is ignoring thermal throttling; ensure stable cooling and consistent power delivery during long benchmark runs. Keep in mind that drivers, OS updates, and Blender optimizations can shift results between versions. To maximize accuracy, run benchmarks on a clean system profile and avoid background tasks that may skew results. Finally, publish your methodology so others can replicate or challenge your conclusions.
Example benchmark scenarios for Blender rendering
| Test Scene | Resolution | GPU Render Time | CPU Render Time |
|---|---|---|---|
| Architectural Interior | 1920x1080 | 1.8 s | 9.5 s |
| Product Shot (4K) | 3840x2160 | 3.2 s | 15.0 s |
| Animation Render (24fps) | 1920x1080 | 2.4 s/frame | N/A |
Frequently Asked Questions
What is blender bench?
A blender benchmark is a data-driven assessment of Blender's rendering performance across hardware and software configurations. It uses standardized scenes and settings to measure render speed, memory usage, and reliability.
A blender bench tests how fast Blender can render a scene on your hardware, using a fixed scene and settings for fair comparisons.
Which Blender settings affect benchmark results the most?
Resolution, samples, denoising, and light path settings typically have the biggest impact on render time. Other factors include scene complexity and the rendering engine (Cycles vs. EEVEE).
Resolution, samples, and denoising largely drive render times; other factors include scene complexity and engine choice.
Should I benchmark GPU or CPU first?
If your primary work is GPU-accelerated rendering, start with GPU benchmarks. For CPU-heavy tasks or animations with non-GPU tasks, run CPU benchmarks as a baseline for comparison.
Start with the GPU if you render with GPU; also benchmark CPU for a complete picture, especially for animation tasks.
How do I ensure fair comparisons across systems?
Use identical scenes, Blender version, and render settings. Normalize results by resolution and samples, and report all environment details (drivers, OS, hardware).
Keep the scene, version, and settings the same, and normalize results for fair comparisons.
Can I reuse benchmarks for other projects?
Yes. Save the exact test files, scene assets, and settings so you can re-run the benchmark on future hardware upgrades or software updates.
Absolutely—preserve your test setup so you can repeat tests on new hardware or Blender versions.
“Benchmark data is the most trustworthy way to compare rendering performance across hardware and software; it reveals bottlenecks that synthetic tests miss.”
What to Remember
- Run tests on the same Blender version and scene.
- Record GPU render times to compare acceleration.
- Include memory usage and denoising impact.
- Normalize results by resolution and samples.
- Document settings for reproducibility.
- Use benchmarks to guide upgrade decisions.